14. State Vegetation
Le rapport sur l’état de l’environnement 2022 est un document technique destiné à un usage interne. Il n’est disponible qu’en anglais.
Introduction
Vegetation provides habitat and food for wildlife, and ecosystem services such as food, fuel and many other products for people. The presence and type of vegetation defines landscapes and is an essential component of any environment or biome. NWT has large sections of two of the Earth's biomes: the taiga and the tundra.
Indicators of vegetation and factors that affect vegetation, such as wildfire and insect disturbances, can help track changes in the health and integrity of taiga and tundra ecosystems. Indicators related to responses of vegetation to stresses like climate change, land uses, and disturbances can provide early warning of changes in northern ecosystems that are difficult to measure due to a variety of factors. These vegetation indicators provide information on condition, changes and trends in vegetation communities of taiga and tundra ecosystems.

14.1 Land Cover Types by Ecozone
This indicator describes the distribution of 14 primary land cover types over the five ecozones (also known as level II ecoregions) of the NWT. Please refer to the map below for reference.

This indicator was prepared by the Government of the Northwest Territories, Department of Environment and Climate Change, primarily using information obtained from Earth Observation for Sustainable Development of Forests (EOSD) and Land Cover of Canada product.
The EOSD (Ref. 1) data are built through a joint program of the Canadian Forest Service (CFS) and the Canadian Space Agency (CSA) with participation and support from the GNWT. The EOSD was developed as part of a forest monitoring system for Canada and was updated through a partnership between the GNWT and the CFS for the Taiga Plains ecozone. EOSD is designed to provide, over the long term, products for forest inventory, forest carbon accounting, monitoring of sustainable development, and landscape management using space-based earth observation data. Inputs from EOSD are an important data source in the National Forest Carbon Monitoring, Accounting, and Reporting System (Ref. 2) and Canada’s plot-based National Forest Inventory (Ref. 3). Data reported for the Northern Arctic and Southern Arctic ecozones are from the Land Cover of Canada (2015) product (see Technical Notes on North American Land Change Monitoring System (NALCMS).
NWT Focus
Land cover mapping is important to provide baseline data that are used for a multitude of planning, monitoring, and research related endeavors. The data is used in regional sustainable forest management planning and monitoring of land cover change. Vegetation information is also used to examine forest health and vegetation responses to disturbances (i.e., wildfire) at the landscape level. In addition, land cover mapping is required to meet commitments made in international agreements on climate change (e.g., National Forest Carbon Monitoring, Accounting, and Reporting System - NFCMARS) and biodiversity (e.g., UN Convention on Biological Diversity - CBD).
The information showcased in this indicator describes how land cover and vegetation communities are distributed across the NWT ecozones.
Current View: status and trend

Table 1. Land cover class by Ecozone (km2)

Table 2. Land cover type by Ecozone (%)

Looking around
Most other jurisdictions in Canada have detailed aerial-photo based vegetation inventories. Some jurisdictions in Canada get new complete air-photo coverage of their province on a 10-year cycle. The NWT has similar detailed information for very localized areas, covering approximately 10% of our forested area, which is not updated on a regular basis due to the extremely high cost and our large landscape. The EOSD land cover is a baseline dataset from which to build inventory-based products to represent the landscape of the NWT.
Many programs use this indicator to track changes to vegetation over time and increase understanding of sustainability and carbon storage. Information from the NWT is added to information from other areas of Canada and the world, and reported back to the following organizations:

Looking forward
The large wildfires of 2013, 2014, and 2015 collectively burned more than three million hectares of forested areas. As shown in Indicator 14.2 (Annual Area Burned and Number of Fires), the NWT has experienced periods with large wildfire occurrences every 10-20 years. The NWT EOSD land cover will support the monitoring of post-wildfire regeneration over time.
Climate change may cause significant changes to the distribution of land cover types if there are significant changes in precipitation or incidence of wildfires. Many vegetation species, including trees, are at the edge of their northern range limit, so impacts may be more obvious than in other ecoregions of Canada. For example, changes in tundra vegetation (i.e., more shrubs [willows]) are being observed near the treeline (Ref. 5), and satellite measurements are showing that the tundra is becoming greener with more growth of vascular vegetation recently (see Indicator 14.5: Trends in shrub cover above the treeline).
Find out more
Refer to indicator 14.2 (as above)
Refer to indicator 14.5 (as above)
For information on the Multi-Source Vegetation Inventory partnership project, use this link:
The NWT Ecosystem Classification reports and posters can be found here: https://www.ecc.gov.nt.ca/en/services/ecosystem-classification
The NWT Ecosystem Classification data and comprehensive aerial photograph library can be found here: https://www.maps.geomatics.gov.nt.ca/Html5Viewer_PROD/index.html?viewer=FMD_ELC
Technical Notes
The land cover classification can be viewed through the GNWT Centre for Geomatics Image Service: https://www.image.geomatics.gov.nt.ca/arcgis/rest/services/Mosaics/NRCAN_CCRS_NALCMS_LandCover_VegetaionType_2015/ImageServer.
More information about the North American Land Change Monitoring System (NALCMS) can be found here: http://www.cec.org/north-american-environmental-atlas/land-cover-30m-2015-landsat-and-rapideye/
References:
Ref. 1. Natural Resources Canada. Canadian Forest Service. Earth Observation for Sustainable Development of Forests: https://www.nrcan.gc.ca/our-natural-resources/forests/sustainable-forest...
Ref. 2. Natural Resources Canada, Canadian Forest Service, National Forest Carbon Monitoring, Accounting and Reporting System: http://www.nrcan.gc.ca/forests/climate-change/13087
Ref. 3. Natural Resources Canada, Canadian Forest Service, National Forest Inventory. Available at: https://nfi.nfis.org/index.php
Ref. 4. 2015 Land Cover of Canada, Canada Centre for Remote Sensing (CCRS), Natural Resources Canada. Available at: https://open.canada.ca/data/en/dataset/4e615eae-b90c-420b-adee-2ca35896caf6
Ref. 5. Communities of Aklavik, Inuvik, Holman Island, Paulatuk and Tuktoyaktuk, Nickels, S., Buell,M., Furgal, C., Moquin, H. 2005. Unikkaaqatigiit – Putting the Human Face on Climate Change:Perspectives from the Inuvialuit Settlement Region. Ottawa: Joint publication of Inuit Tapiriit Kanatami, Nasivvik Centre for Inuit Health and Changing Environments at Université Laval and the Ajunnginiq Centre at the National Aboriginal Health Organization
14.2 Annual Area Burned and Number of Wildfires
This indicator measures the annual number of wildfires and area impacted by fires with a perimeter large enough to map using satellite information.
This indicator was prepared by the Government of the Northwest Territories, Department of Environment and Climate Change, using information obtained from Forest Management Division.

NWT Focus
Wildfire is the major stand-renewing natural disturbance in the boreal and taiga forests around the world. Under the right climatic and fuel conditions, such as hot, dry and windy weather, and low forest fuel moisture, forests of western North America can support high-intensity wildfires. High-intensity wildfires often occur naturally and have the potential to spread quickly, covering large areas. Tracking wildfires in the NWT is essential to maintaining natural ecosystems and protecting human life, property and other values at risk. An accurate understanding of the number of wildfires and area affected is necessary to effectively monitor the state of the environment and manage forest resources.
Current View: status and trend
While wildfire is a regular feature on the landscape, large differences are seen in area burned and the number of wildfires between years, NWT historical fire information from 1969 to 2021 is shown in Figure 1 and highlights the among year variability in the number and size of fires. Linear regressions on the total area burned (hectares) and the number of fires did not detect any significant trends. On average, every year, about 249 wildfires occur in the Northwest Territories burning on average 500,000 hectares of land. As the climate continues to change, it is predicted that the NWT will see more extreme years, both in terms of hot dry years and cold rainy years, which could make managing wildfires in the NWT increasingly challenging.


Looking around
89.5% of wildfires in the NWT are naturally caused by lightning. Human caused wildfires in the NWT account for 10.5% of all fires which is low in comparison to other jurisdictions. For example, in 2021, 62% of fires in Alberta were person-caused, and in Saskatchewan the total was 43%.
Details on every wildfire in the NWT is provided to Natural Resources Canada and that data contributes to the Canadian National Fire Database which provides Canada-wide information on fire as an indicator of the state of the environment in Canada.
Looking forward
Given the importance of wildfire on the landscape, the costs and challenges of wildfire management and risks to human life, property and other values coupled with the potential implications of climate change, it is important to ensure accurate baseline information is collected to monitor environmental change and establish effective wildfire response planning.
The impacts of climate change are still uncertain although research suggests our climate is likely to become less predictable and may result in more extreme weather events, longer fire seasons, as well as changes in precipitation, water tables and temperature. These factors can also contribute to other vegetation stressors such as insects and disease outbreaks, which could result in more extreme wildfire seasons making this a very important indicator to continue to monitor.
Find out more
For information on the current fire situation in the NWT go to www.nwtfire.com
For more information on wildfire nationally, please visit https://cwfis.cfs.nrcan.gc.ca/ha/nfdb.
Technical Notes
The data for this indicator are based on analysis of a GNWT fire history GIS dataset. The fire count statistic is calculated from the ignition point dataset as collected by the NWT EMBER system. Note that not all wildfires reported in EMBER are represented in the fire history GIS dataset; this is especially true for wildfires smaller than a hectare.
References
Ref. 1. Web. Wildfire Operations. GNWT. Available at: https://www.ecc.gov.nt.ca/en/services/wildfire-operations
Ref. 2. Web. NWT Live Fire Map. GNWT. Available at: https://www.ecc.gov.nt.ca/en/services/wildland-fire-update/nwt-live-fire-map
Ref. 3. Zip. Fire History Data. GNWT. Download at: http://www.geomatics.gov.nt.ca/Downloads/Vector/Biota/FireHistory.zip?h=1
14.3 Trends in invasive alien plant species
This indicator tracks long-term changes in plant communities due to the introduction and spread of alien plant species in NWT ecosystems.

This indicator is also used to track the status of vascular plant species in the NWT General Status Ranking Program. All species tracked by this indicator are alien species, which are defined as species that have been introduced into North America from Europe or Asia as a result of human activities.
The indicator also provides information on the level of invasiveness for each alien species. Invasive species are harmful alien plant species whose introduction or spread threatens the environment, the economy, or society. Plants can be invasive in one area or ecosystem and less invasive in another and may be considered synonymous with weeds.
Predicted levels of invasiveness for species are preliminary and apply to the entire NWT, based on assessments in Canada (Ref.1). These may change in future as more studies and information becomes available. The following categories are used to describe the level of invasiveness.
High = Invades man-made disturbed habitats and natural habitats quickly. Hard to eradicate. Has severe ecological impacts on physical processes, plant or animal communities, and vegetation structure. Reproductive biology and other attributes are conducive to moderate to high rates of dispersal and establishment. Most are widely distributed ecologically.
Moderate = Invades man-made disturbed habitats and invades some natural habitats. These species are invasive but their ecological impacts are moderate or there was not enough information to justify a higher score. Ecological amplitude and distribution are generally limited, but these species may be locally persistent and problematic.
Low = Invades man-made disturbed habitats and some natural habitats with natural disturbances.
These species are invasive but their ecological impacts are low or there was not enough information available. Ecological amplitude and distribution are generally very limited, but these species may be locally persistent.
Potential = Can invade disturbed habitats if conditions are favourable. These species can be invasive but there was not enough information available. Ecological amplitude and distribution are generally very limited, but these species may be locally persistent.
This indicator was prepared by the Government of the Northwest Territories, Department of Environment and Climate Change, using information obtained from the NWT Species General Status Ranking Program.
NWT Focus
Changes in the number of alien species in the NWT are monitored as their presence and abundance may affect the status of wild species native to NWT. Plant species can be introduced to the NWT as food crops, habitat remediation tools, landscaping varieties, or unintentionally. The majority of introduced (alien) plant species cause no damage to natural ecosystems because they need constant human assistance to survive and do not spread. NWT’s climate prevents many species from establishing themselves in NWT ecosystems. Some introduced plant species have, however, succeeded in spreading in some habitats, mostly those already disturbed by human activities. Some introduced plant species can spread and cause harm to natural habitats, out-competing native plant species.
Current View: status and trend
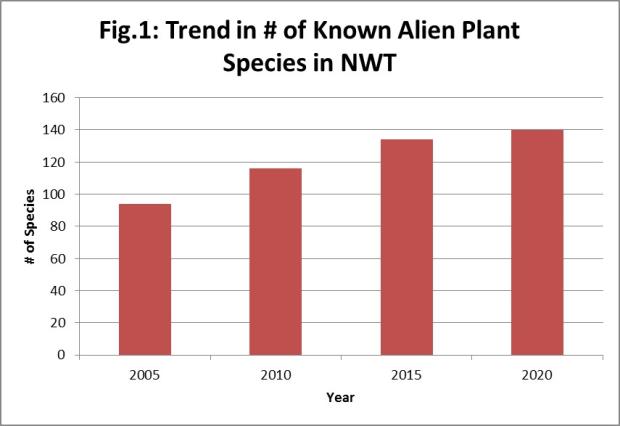
As shown in Figure 1, in 2020, 140 alien plant species were known to occur in the NWT2. In 2015, there were 134, in 2010, there were 116, and in 2005, 94 alien plant species were known to occur here.
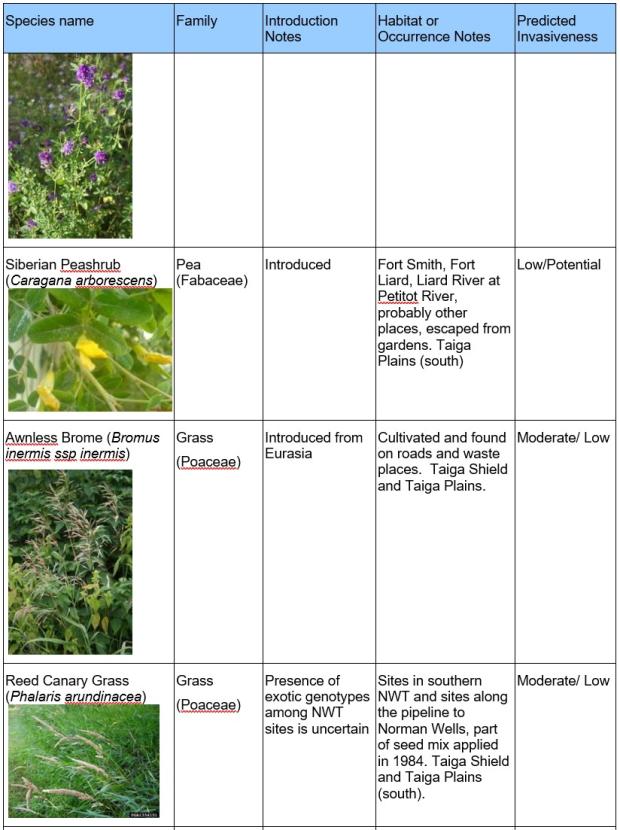
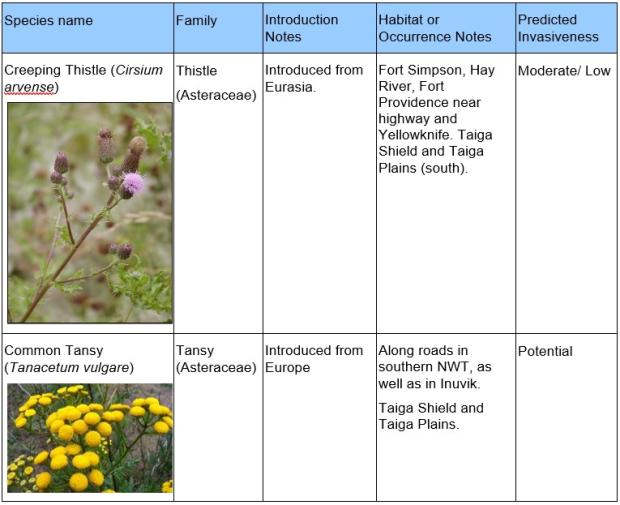
These species are mostly found in or near communities, near roads, and along disturbed areas such as cut-lines, pipelines, and mine sites. Of these 140 species, few have demonstrated that they can invade natural habitats (Ref. 2) (see table below). White and yellow sweet clovers are increasingly common in the NWT, from the Alberta border up to Norman Wells and Inuvik. These species are widespread in communities and along roads (Ref 3, 4). The two most invasive species (White and Yellow Sweet Clovers) are known to be spreading along the Liard and Mackenzie River shores and sand bars, where they thrive in sunny areas with low competition from shrubs and trees. These species are now known to also invade river margins and sandy and muddy natural habitats in Alaska and Yukon (Ref. 5).
The predicted invasiveness of alien plant species is based on studies from across Canada (Ref.1, 6) and is applied to the NWT in a preliminary fashion. More studies on the distribution and biology of alien plants in the NWT are being conducted (Ref. 7).

Some plant species have both native and alien subspecies and varieties. These species may be used in seed mixes, especially if these varieties have been selected for “aggressiveness” or “pioneer capacity” which reflects their capacity to quickly grow, invade, and cover an area to offer some erosion control. However, as only the species name is usually reported in re-generation programs, rather than the full subspecies or variety name, it becomes difficult to determine whether alien subspecies/varieties or native ones are being used. The invasiveness potential of these subspecies is mostly unknown for the NWT. Some of these subspecies are found today along seismic lines, pipelines or re-vegetated mines and other sites.
Looking around
In areas where there is greater native plant diversity (number of plant species), more species of alien plant species are also usually found (Ref. 8). If a province or territory is rich in native plant species, it tends to harbour more exotics. Conversely, if a region is poor in native plants, it usually has fewer exotics. The NWT has the number of alien plant species expected for a north-western jurisdiction in Canada considering the number of native species present here.
Looking forward
The NWT can learn from the extensive efforts other North American jurisdictions are engaged in to prevent the introduction of, control and eradicate invasive alien plants that could threaten native ecosystems, habitats, or species. The threat of invasive alien species to the NWT’s ecosystems has tended to be underestimated, assuming that the extreme northern climate will prevent most species from establishing themselves here. With continuing development in the NWT, and an increase in habitat changes expected in the Taiga Plains, communities are preparing to increase their awareness of the risks related to alien plants and to help reduce that risk. NWT residents have noticed an increase in plant species that are “out-of place” – or alien and “taking over some habitats” – or becoming invasive.
With continued disturbance as well as environmental and climate change, the NWT can expect more alien plant species to arrive and some to move to natural habitats and become invasive. There is increasing demand in the NWT for seed mixes containing native plant species for work in re-vegetation plans and mitigation activities.
The NWT Council on Invasive Species, Pests and Pathogens, established in 2021, will play an important role in reducing the threats of invasive plants in our ecosystems. Their efforts will be tracked in this indicator in the future.
Find out more
Find out more about invasive alien species in Canada at https://www.canada.ca/en/environment-climate-change/services/biodiversity/invasive-alien-species-strategy.html, and around the world with the IUCN Invasive Species Specialist Group http://www.issg.org/. Additional information on the biology and global distribution of all alien plant species found in the NWT can be accessed on the Global Invasive Species Database, managed by the Invasive Species Specialist Group (ISSG) of the IUCN Species Survival Commission http://www.iucngisd.org/gisd/
Information on the NWT Council on Invasive Species, Pests and pathogens can be found at: https://nwtcispp.ca
Other focal points
Information on alien mammals, birds and fish species is found in the WILDLIFE focal point.
Technical Notes
The definition of invasiveness is based on the definition contained in the Convention on Biological
All photos are from Mike Oldham © ECC, GNWT, except the Reed Canary Grass photo which is from Chris Evans, River to River CWMA, Bugwood.org (at www.fs.fed.us/database/feis/plants/graminoid/phaaru/all.html), the Crested Wheat Grass photo from Dave Powell (USDA Forest Service); the Hoary False-alyssum photo from Field Guide to Noxious and Other Selected Weeds of British Columbia (/www.agf.gov.bc.ca); the Creeping Thistle © I Lapina– image from Alaska; and the Common Tansy photo from http://commons.wikimedia.org/wiki/User:Fir0002.
References
Ref. 1. Canadian Botanical Conservation Network. 1997. Invasive Herbaceous Species List. Available at http://www.rbg.ca/archive/cbcn/en/projects/invasives/i_list.html.
Ref. 2. Working Group on General Status of NWT Species. 2021. NWT Species Infobase. Available at https://www.ecc.gov.nt.ca/en/services/biodiversity/nwt-species-infobase
Ref. 3. Oldham, M. 2007. The 2006 survey of exotic plants along Northwest Territories highways. Report to the GNWT. Available at http://www.ecc.gov.nt.ca/sites/default/files/reports/exotic_plants_survey.pdf.
Ref.4. Oldham and Oldham. 2016. Report on the 2016 Survey of Exotic Plants along Northwest Territories Highways. GNWT and MNRF Science (Ontario). 53 pp. Available at https://www.ecc.gov.nt.ca/sites/ecc/files/resources/report_on_the_2016_survey_of_exotic_plants_along_northwest_territories_h.pdf
Ref. 5. Conn, J.S., K.L. Beattie, M.A. Shephard, M.L. Carlson, I. Lapina, M. Hebert, R. Gronquist, R. Densmore, and M. Rasy . 2008. Alaska melilotus Invasions: distribution, origin, and susceptibility of plant communities. Arctic, Antarctic, and Alpine Research 40(2): 298.
14.4 Status of species harmful to forests in the NWT
This indicator tracks species of insects and spiders present in the NWT that are considered alien, invasive, or pests, and that can be harmful to our plant communities, including forests.
This indicator uses information collected for the NWT General Status Ranking Program (GSRP) (Ref 1) and from a project called: Risk Analysis and Management of Alien Plant and Insects in the Northwest Territories, funded by Environment and Climate Change Canada (ECCC), Crown-Indigenous Relations and Northern Affairs Canada (CIRNAC), GNWT Environment and Climate Change (ECC), Parks Canada, and Agriculture Canada. Additional information on forest pest insects was obtained from forest experts in the ECC Forest Management Division, and from the Natural Resources Canada (NRCAN) webpage: Forest Invasive Alien Species in Canada (Ref. 2).
This indicator tracks species using four definition codes:
Alien = species (plants, animals, and micro-organisms) that have been introduced as a result of human activities. Same definition as used in the GSRP.
New – range extension = species newly discovered in the NWT, for which there is evidence of recent range extension. This definition helps to track “true” new species to the NWT as their pattern of distribution changes. Same definition as change code “new species” in the GSRP. Uncertainties are noted.
Invasive = Alien species that spread and threaten ecosystems, and by extension the environment, the economy or society. All invasive species are alien. For native species that have invasive-like habits, see the “Pest” definition. Some alien insects are deemed forest invasive, as they feed on trees and spread over large tracks of NWT forest and can change an entire landscape for many years.
Pest = Native or alien species that can spread, and at least in some years, can threaten a component of an ecosystem that has economic value (e.g., timber).
This indicator was prepared by the Government of the Northwest Territories, Department of Environment and Climate Change, using information obtained from various sources.
NWT Focus
Changes in the number of alien, invasive, or pest species of insects and spiders in the NWT provides an indicator of ecosystem change, including habitat and climate change. Changes in the number of alien insects and spiders are also monitored as their presence and abundance may affect the status of wild species native to the NWT.
Arthropods (e.g., insects, spiders) form the most diverse part of the NWT’s biodiversity. It is estimated that thousands of arthropod species can be found in the NWT’s ecosystems. Insects and spiders have adapted to harsh climates, and the great majority of the NWT’s species are present year-round (i.e., they are not migratory). The number of alien and pest species present south of the NWT is much greater. Changes in the northern environment may favour more advancement of these species into our ecosystems.
Current View: status and trend
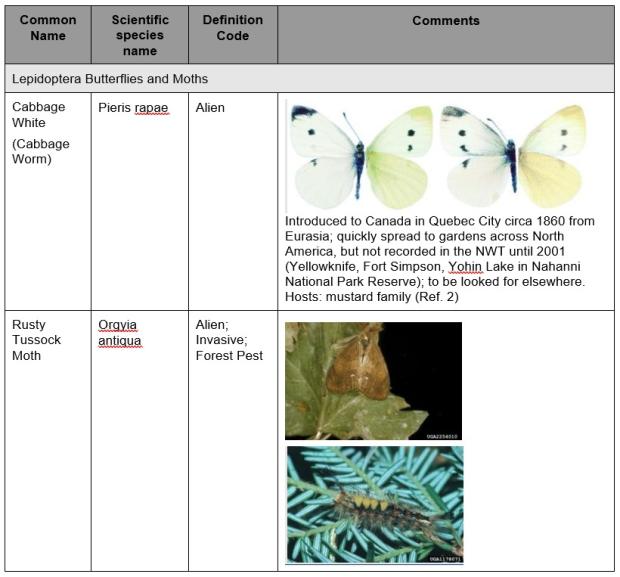
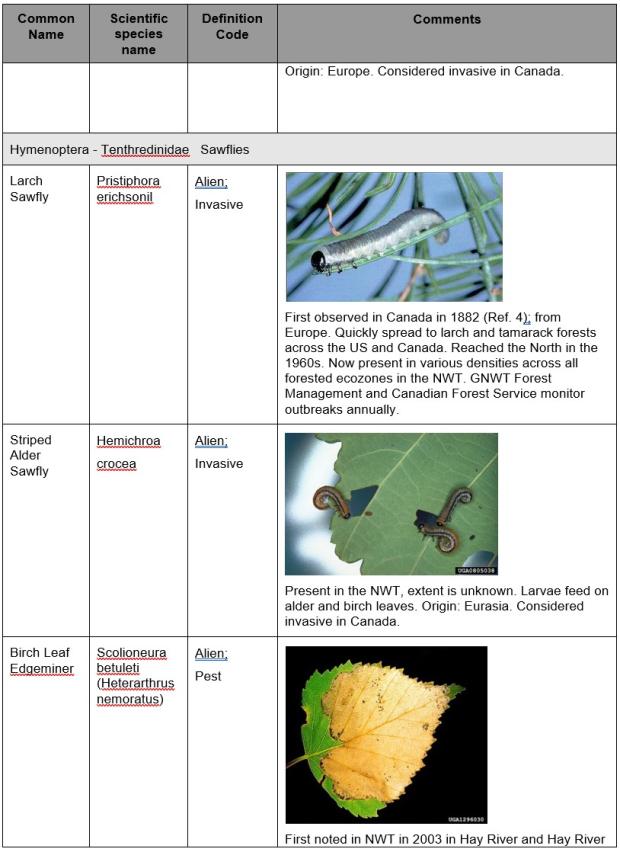
So far, we know of 11 alien species of insects and no invasive species of spiders that are present in the NWT. Most of these insect species have been noted in the NWT for more than 50 years, but the extent of their distribution is unknown. Two of these alien species (the Larch Sawfly and the Amber-marked Birch Leafminer) are subject to monitoring programs.
Table 1. Alien species of insects present in the NWT


Source: Information from the NWT General Status Ranking Program and as referenced.
Butterflies photos courtesy of The Butterflies of Canada by Ross A. Layberry, Peter W. Hall, and J. Donald Lafontaine. University of Toronto Press; 1998. (web version).
Larch sawfly larva photo courtesy of University of Georgia, obtained from /www.fs.fed.us/r10/spf/fhp/leafletts/Larsaw.htm
Rusty Tussock Moth photo: adult: USDA Forest Service Archives, USDA Forest Service, www.forestryimages.org, caterpillar: Connecticut Agricultural Experiment Station Archives, Connecticut Agricultural Experiment Station, www.forestryimages.org
Birch-aspen Leafroller Moth photo courtesy of Edward H. Holsten, USDA Forest Service, Bugwood.org, obtained from www.forestryinmages.org.
AMBLM and Birch Leafminer: Thérèse Arcand, Natural Resources Canada, Canadian Forest Service, Laurentian Forestry Centre
Small Sprucebud Scale: Edward H. Holsten, USDA Forest Service, United States, Bugwood.org
Larch Woolly Adelgid: Louis-Michel Nageleisen, Département de la Santé des Forêts, Bugwood.org
Striped Alder Sawfly: USDA Forest Service - Alaska Archive, USDA Forest Service, Bugwood.org
Poplar Blackmine Beetle : Whitney Cranshaw, Colorado State University, Bugwood.org
European alder leafminer: Whitney Cranshaw, Colorado State University, Bugwood.org
Mountain Pine Beetle photo: UGA0949030 from www.forestryimages.org
In addition to alien species, some native insects such as the spruce budworm (Choristoneura fumiferana), tent caterpillars (Malacosoma spp.), and bark beetles (Family Scolytidae) can significantly damage NWT forests. Outbreaks of native insects are an expected and normal part of life in the northern boreal forest. However, climate change could alter the location, frequency and intensity of outbreaks of native and invasive alien species, including species that have not been important defoliators in the past. Monitoring changes in damage caused by all forest insects allows managers to predict impacts on overall forest health.
The most significant native pest species in the NWT is spruce budworm, which has been monitored in the NWT since 1950s. In the late 1990s and early 2000s there was an unprecedented outbreak of spruce budworm population along the Mackenzie River Valley. However, by 2002 the population started to decline, and in 2005 the population returned to normal levels and has stabilized since. ECC’s Forest Management Division conducts annual Forest Health Surveys along areas identified as high risk (i.e., along major rivers and waterways or uplands and hill slopes). Over 6000 km of survey routes are monitored each summer to detect defoliation caused by insect pests that include aspen serpentine leafminer (Phyllocnistis populiella), willow blotch leafminer (Micrurapteryx salicifoliella), and forest tent caterpillar (Malacosoma disstria).
Looking around
The mountain pine beetle (Dendroctonus ponderosae), one of the more intensely monitored forest pest insects in western North America, is creating unprecedented damage to pine forests in British Columbia and Alberta. Mountain pine beetle was observed in the NWT for the first time in summer 2012, but has not been recorded in the NWTafter the affected pine stand burned in 2013. A mountain pine beetle pest risk analysis for the NWT pine forests was prepared in 2013 indicating low risk of establishment and spread by 2020 and moderate to high risk by 2070 (Ref. 6 and Ref. 7). Since 2014, the dedicated mountain pine beetle surveys have been in place to monitor for this new invasive pest which is one of the most damaging insects in North America.
Looking forward
NWT residents can help track the distribution of alien species in the NWT by reporting their presence to ECC. Official species lists have been compiled for the NWT General Status Ranking Program since 2000 (Ref. 1), and include butterflies, tiger beetles, dragonflies and damselflies. Official species lists for NWT spiders, some groups of beetles, moths, deer flies, horse flies, bees, black flies and mosquitoes are being developed and will be available for tracking for this indicator in 2010. Updates on new species of insects are provided through the contributions of visiting entomologists, tourists, and NWT residents interested in NWT biodiversity. In 2021, The NWT Council on Invasive Species, Pests, and Pathogens, an independent advisory body, was established to provide information, advice, and recommendations to management authorities and other decision makers about threats, best practices, planning, prioritization, and emerging concerns related to invasive species, pests, and pathogens.
Find More
For more information about insects in the NWT and elsewhere in Canada, visit the Biological Survey of Canada website at: http://www.biology.ualberta.ca/bsc/bschome.htm.
For more information on the NWT General Status Ranking Program go to www.nwtspeciesatrisk.ca
For more information on the Mountain Pine Beetle, go to https://www.nrcan.gc.ca/forests/insects-diseases/13381
References
Ref. 1. NWT Species 2016-2020: General Status Ranks of Wild Species in the NWT Report. Available at https://www.nwtspeciesatrisk.ca/sites/enr-species-at-risk/files/nwtspeci...
Ref. 2. Natural Resources Canada. 2021. Forest Invasive Alien Species of Canada. Available at http://www.exoticpests.gc.ca/home.
Ref. 3. Furniss, M.M. 2004. Observations on an introduced bud scale, Physokermes hemicryphus (Homoptera: Coccidae), infesting Norway spruce in Idaho. Can. J. For. Res. 34: 1348-1352. .
Ref. 4. U.S.Department of Agriculture. 2001. The Larch Sawfly, Leaflet R10-TP-101 ed.2001.
Ref. 5. Digweed, SC and DW Langor. 2005. Distributions of leafmining sawflies (Hymenoptera: Tenthredinidae) on birch and alder in northwestern Canada. Can. Entomologist 136: 727-731.
Ref. 6. Hodge, J. 2014. Mountain Pine Beetle Pest Risk Analysis for Northwest Territories Pine Forests. Forest Management Division, Environment and Climate Change.
Ref. 7. Nealis, V. and Peter, B. 2008 Risk assessment of the threat of mountain pine beetle to Canada’s boreal and eastern pine forests. Natural Resources Canada.45 pp. Available at http://cfs.nrcan.gc.ca/pubwarehouse/pdfs/28891.pdf
Ref. 8. US Department of Agriculture (USDA), "The Larch Sawfly," in Leaflet R10-TP-101 ed.2001.
Ref. 9. Snyder, C., C.J.K. MacQuarrie, K. Zogas, J.J. Kruse, and J. Hard. 2007. Invasive species in the last frontier: distribution and phenology of birch leaf mining sawflies in Alaska. J. of Forestry 105:113-115..
14.5 Trends in shrub cover above the treeline
This indicator measures changes in the height, biomass, or percent cover of shrubs above the treeline where they form the dominant vegetation type. Shrubs can be classified as prostrate (non-erect), dwarf (up to 40 cm tall), and tall upright (40-400 cm) and generally decrease in stature and density moving northward from the treeline.
Changes to shrub abundance and distribution can be measured over a range of spatial scales: at local scales using field plot measurements; over landscapes using repeat aerial and ground photography; and at regional-to-continental scales based on analysis of multi-temporal satellite data. Optical satellite imagery is particularly sensitive to tundra vegetation leaf area and above-ground biomass, making this indicator amenable to repeat measurement over large areas.
This indicator was prepared by the Government of the Northwest Territories, Department of Environment and Climate Change, using information obtained various sources.

NWT Focus
Arctic shrubs can respond rapidly to improved growing conditions (i.e., higher temperature and precipitation) and therefore provide a sensitive indicator of climate-driven vegetation change. Shrub growth is also stimulated locally by a variety of natural and human-caused disturbances and often provides the most conspicuous and long-lasting evidence of disturbance. Expanding shrubs may overtop and outcompete lichen, thereby reducing the amount of lichen forage available for barren-ground caribou.
Current view: status and trend
Analysis of coarse resolution satellite imagery shows that the Normalized Difference Vegetation Index (NDVI) is increasing within large areas of the NWT’s treeline transition zone (Ref. 1 to 9). NDVI is sensitive to green leaf area, and in this case is likely responding to increases in shrub cover due to climate change and regeneration following wildfire.
A multi-scale study of vegetation change above the treeline in the northwestern NWT found that the majority of the area experienced a significant increase in NDVI at a 30 m resolution since 1985. The average terrestrial NDVI across the trend surface increased from 0.49 in 1985 to 0.59 in 2011, representing a 21% relative increase in NDVI (Ref. 4). A comparison of over 200 high resolution (~3 cm) aerial photo pairs taken within the Tuktoyaktuk Peninsula in 1980 and 2013 indicates that these NDVI changes are the result of erect shrubs expanding and overtopping lichen (Ref. 4). Plot-based and unmanned aerial vehicle (UAV) measurements at sites where shrubs have expanded also support this interpretation. It is likely that vegetation changes in this region are mainly due to long-term warming trends (Ref. 4). Several studies have shown that tundra shrub growth in NWT is enhanced by feedback from climate change and locally where disturbances expose and warm soils or deepen the active layer (Ref. 1, 2, 8). These include wildfires, thaw slumps, drained lakes, vehicle tracks on seismic lines, and gas well sumps.
The annual report for 2020 from the National Oceanic and Atmospheric Administration (NOAA) supported the findings that from 1982 to 2019, mainland-NWT saw an overall increase in NDVI based on satellite imagery from the Advanced Very High Resolution Radiometer (AVHRR). However, they also saw a decrease in tundra greenness in the NWT’s Arctic Archipelagos for both peak annual NDVI values and the sum of all significant bi-weekly NDVI values (Ref. 10, 11). Vegetation changes at the landscape level (Ref. 12) may have implications for permafrost thaw (Ref. 13).
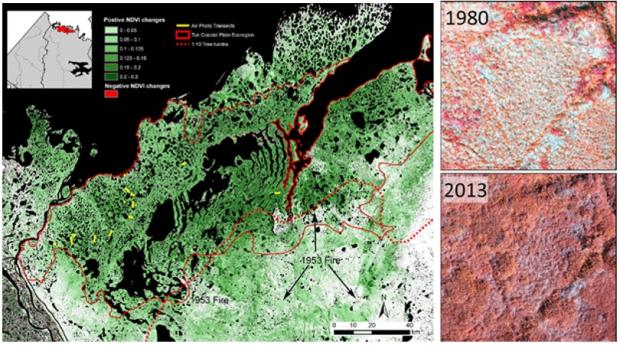
Significant Landsat NDVI changes occurred between 1985 and 2011 within a region to the east of the Mackenzie Delta above the treeline. Close-ups of 1980/2013 colour infrared photo pairs (25 m wide) showed expansion of shrubs with concomitant lichen declines. Deciduous dwarf shrubs (primarily birch) appear red in the 1980 photo, whereas heath shrubs (primarily Labrador tea) appear orange.
Looking around
Both field and satellite-based studies show that shrub expansion is occurring in many locations across the circumpolar southern Arctic (Ref. 2, 5). A recent meta-analysis of tundra vegetation surveys at 46 locations across the globe has also documented increased growth of vascular vegetation under naturally warming conditions (Ref. 6). In addition to the NWT, northern Quebec and Labrador have shown strong increases in NDVI (Ref. 3, 7). Larch, or tamarack, (Larix laricina) is also shown to be establishing further north along and beyond the current circumpolar treeline (Ref. 9) Larch populations increased in 63% of the 173 study sites across the treelines of Siberia and North America, at an expansion rate of 0.06-0.6 m/year (Ref. 9).
Not everywhere is seeing an increase in NDVI as multiple satellite-based studies have demonstrated a decrease in NDVI between 1982 and 2019 in regions of Nunavut’s Arctic Archipelagos, northwestern Russia, eastern Greenland, and Alaska (Ref. 11).
Looking forward
Ecological modeling predicts large-scale northward shifts in Arctic vegetation based on climate change scenarios. More than half of Arctic vegetation is expected to change to a different physiognomic class, with woody vegetation cover increasing by 52% by the 2050s (Ref. 8). These vegetation changes will likely reduce the availability of lichen forage for caribou in some regions and provide additional fuels to promote increased tundra fire activity.
Find out more
NOAA produces an annual Arctic Report Card that includes a chapter on vegetation, with a major focus on shrubs and satellite-based measurements. http://www.arctic.noaa.gov/reportcard/
For more information, refer to the Permafrost focal point for more details on interactions between vegetation changes and permafrost.
Satellite NDVI trends, both at 30 m resolution (Landsat) and >250 m resolution (AVHRR and MODIS) are derived by analyzing a multi-decade record of near peak growing season imagery. Trends are computed separately for each pixel. More details on how NDVI is measured can be found on NASA’s website: http://earthobservatory.nasa.gov/Features/MeasuringVegetation/measuring_vegetation_2.php.
References
Ref. 1. Lantz T.C., P. Marsh, and S.V. Kokelj. 2013. Recent shrub proliferation in the Mackenzie Delta uplands and microclimatic implications. Ecosystems 16:47–59.
Ref. 2. Myers-Smith I.H., et al. 2011. Shrub expansion in tundra ecosystems: dynamics, impacts and research priorities. Environ Res Lett 6:045509.
Ref. 3. Pouliot D., R. Latifovic, and I. Olthof. 2009. Trends in vegetation NDVI from 1 km AVHRR data over Canada for the period 1985–2006. Int J Remote Sens 30:149–68.
Ref. 4. Fraser, R.H., T.C. Lantz, I. Olthof, S.V. Kokelj, and R.A. Sims. 2014. Warming-induced shrub expansion and lichen decline in the Western Canadian Arctic. Ecosystems 17:1151–1168.
Ref. 5. Epstein, H.E., et al. 2012. Dynamics of aboveground phytomass of the circumpolar arctic tundra during the past three decades. Environ. Res. Lett. 7:015506.
Ref. 6. Elmendorf S.C., et al. 2012. Plot-scale evidence of tundra vegetation change and links to recent summer warming. Nat Clim Change 2:453–457.
Ref. 7. McManus K.M., et al. 2012. Satellite-based evidence for shrub and graminoid tundra expansion in northern Quebec from 1986 to 2010. Glob Change Biol 18:2313–23.
Ref. 8. Pearson R.G., et al. 2013. Shifts in Arctic vegetation and associated feedbacks under climate change. Nat Climate Change 3:673–7.
Ref 9. Mamet, S.D., Brown, C.D., Trant, A.J., Laroque, C.P. 2019. Shifting global Larix distributions: Northern expansion and southern retraction as species respond to changing climate. Journal of Biogeography, 26, 30-44.
Ref 10. Ju, J., and J.G. Masek. 2018. ABoVE: NDVI trends across Alaska and Canada from Landsat, 1984-2012. ORNL DAAC, Oak Ridge, Tennessee, USA. https://doi.org/10.3334/ORNLDAAC/1576.
Ref. 11. Frost G.V., et al. 2020. Tundra Greenness. National Oceanic and Atmospheric Administration
Ref. 12. Bonney et al. 2018. Landscape variability of vegetation change across the forest to tundra transition of central Canada. Remote sensing of Environment. 217: 18-20 Available at https://www.sciencedirect.com/science/article/abs/pii/S0034425718303675
Ref. 13. Wilcox et al. 2019. Tundra shrub expansion may amplify permafrost thaw by advancing snowmelt timing. Arctic Science, 5(4) Available at https://cdnsciencepub.com/doi/full/10.1139/as-2018-0028